 cast_otter
TSMC Q3: revenue is already out. Margins are not
Add up July–September monthly sales and you get NT$1,494.2B, about 2% above the top of guidance. On Thursday Oct 15 the number to watch is margin, not revenue.
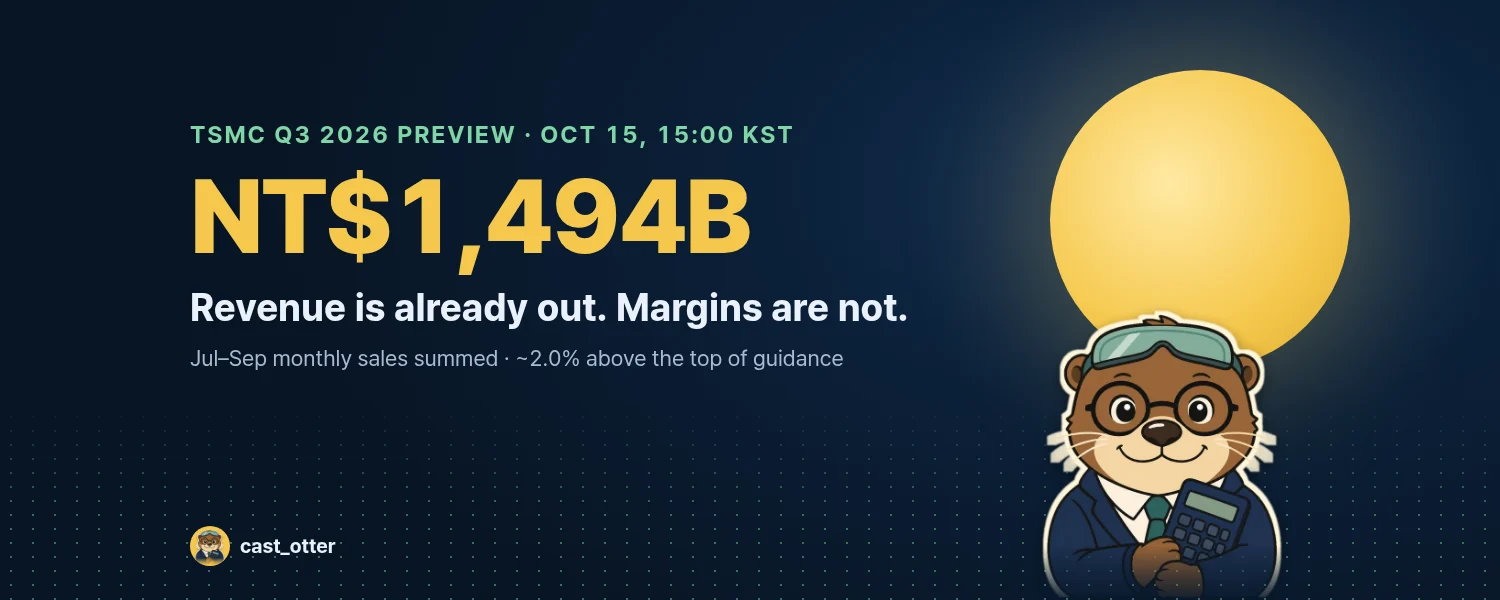
NT$1,494.2 billion.
That's TSMC's July, August and September revenue added together. It lands about 2% above the top of the Q3 guidance the company gave in July.
So by Thursday's call (Oct 15), revenue is effectively known. One question is left: how much of it did they keep?
※ Based on TSMC's official releases as of Oct 11, 2026 (KST). Not investment advice.
What's inside
- Q3 revenue from three monthly reports
- How it compares with guidance
- The Q2 scorecard, revisited
- Why margins are the real question
- A five-item checklist for Thursday
1. Three monthly reports make a quarter
TSMC publishes the previous month's revenue around the 10th of every month. That lets you add up the quarter before the earnings call.
- July: NT$467.58B
- August: NT$514.81B
- September: NT$511.86B (−0.6% vs August, +54.6% vs a year ago)
Together that's NT$1,494.24B. That's 50.9% more than Q3 2025 (NT$989.92B) and 17.6% more than Q2 2026 (NT$1,270.38B).
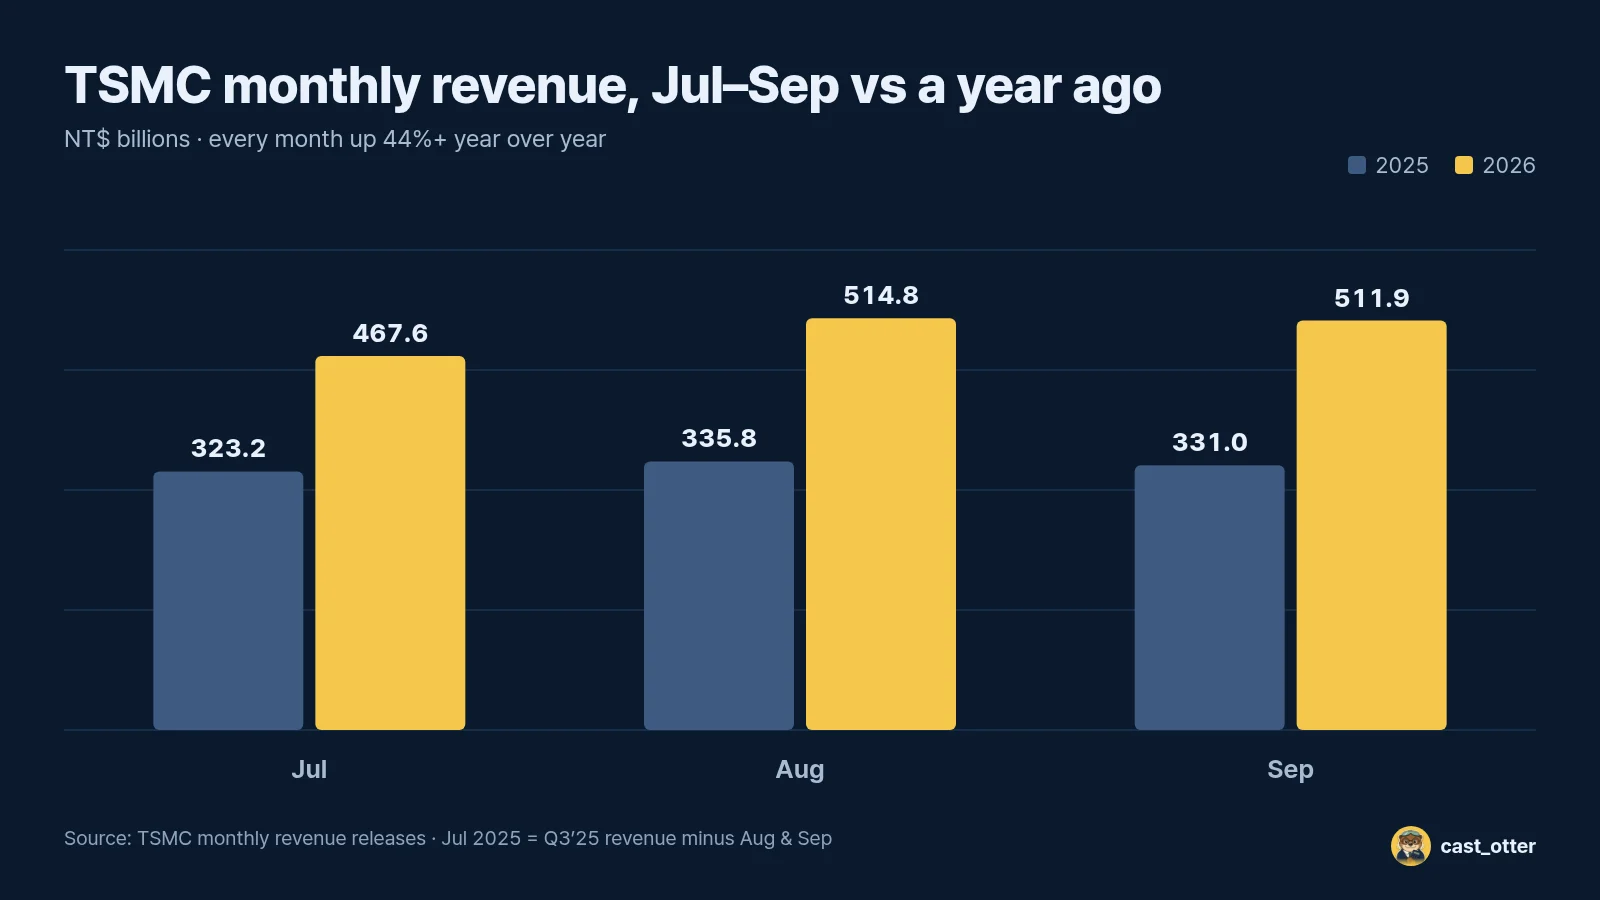
September did dip 0.6% from August. It was still 54.6% higher than a year earlier. Year-to-date revenue through September reached NT$3,898.73B, up 41.1%.
2. Against guidance: about 2% above the top
In July, TSMC guided Q3 revenue to US$44.6–45.8B, assuming 32 NT$ per US dollar.
At that rate, the range is NT$1,427.2–1,465.6B. The monthly sum of NT$1,494.2B sits about 2.0% above the top.
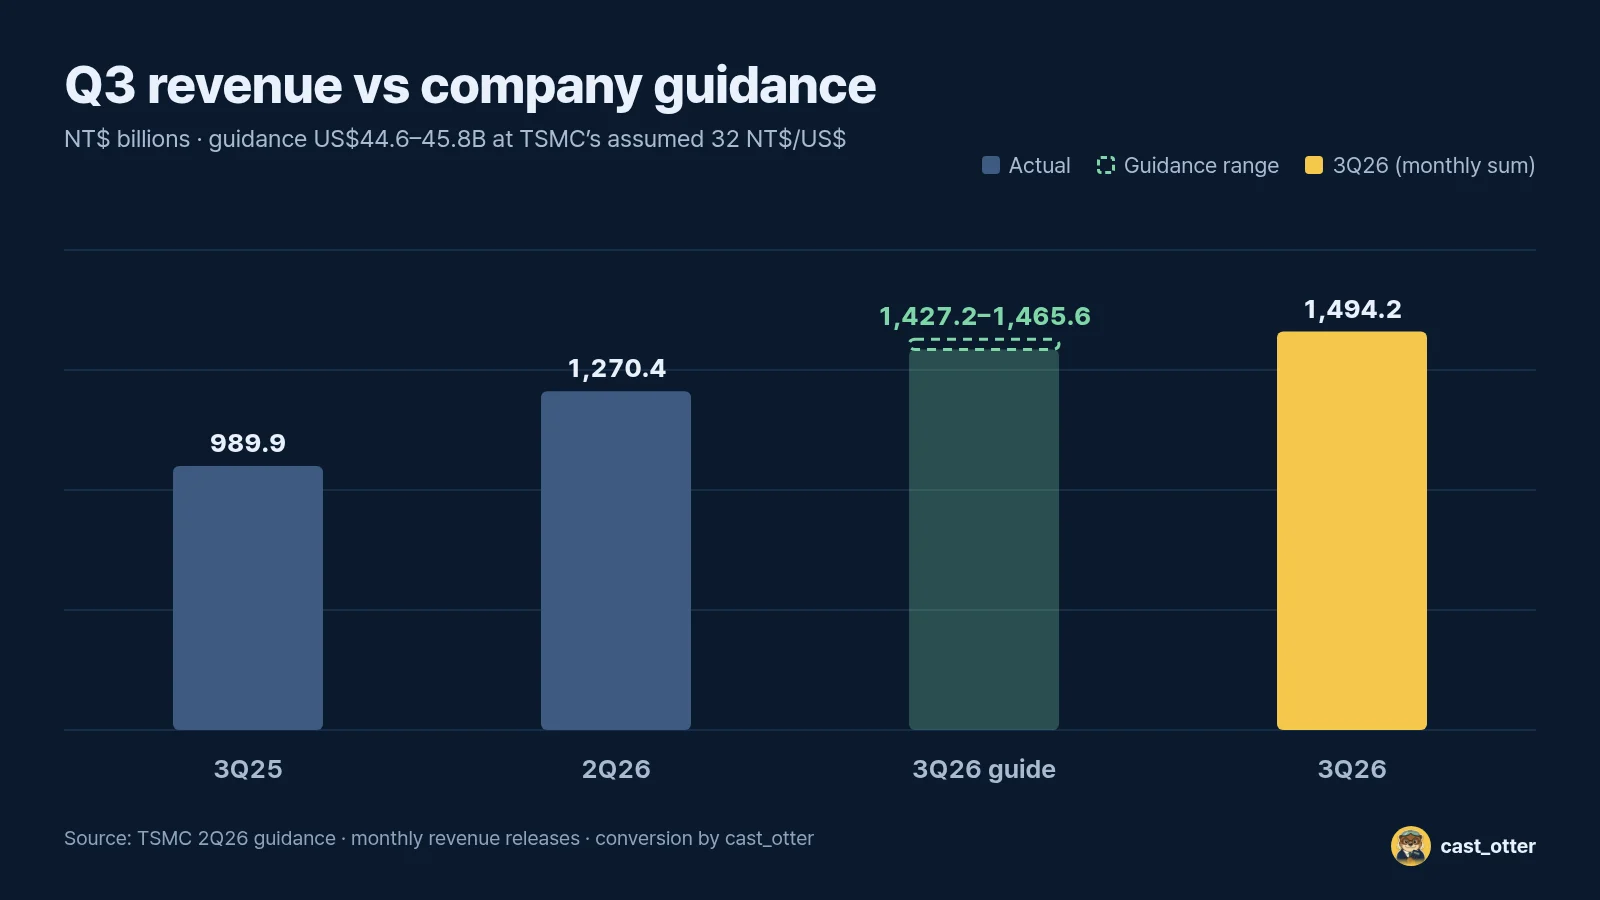
That conversion is ours. If the actual Q3 average exchange rate was away from 32, the US-dollar revenue TSMC reports, and the "vs guidance" gap, can come out different.
3. The Q2 scorecard, revisited
Here's the baseline.
- Revenue NT$1,270.38B, +36% year over year
- Gross margin 67.7%, operating margin 60.3%
- Net income NT$706.56B, net margin 55.6%, EPS NT$27.25
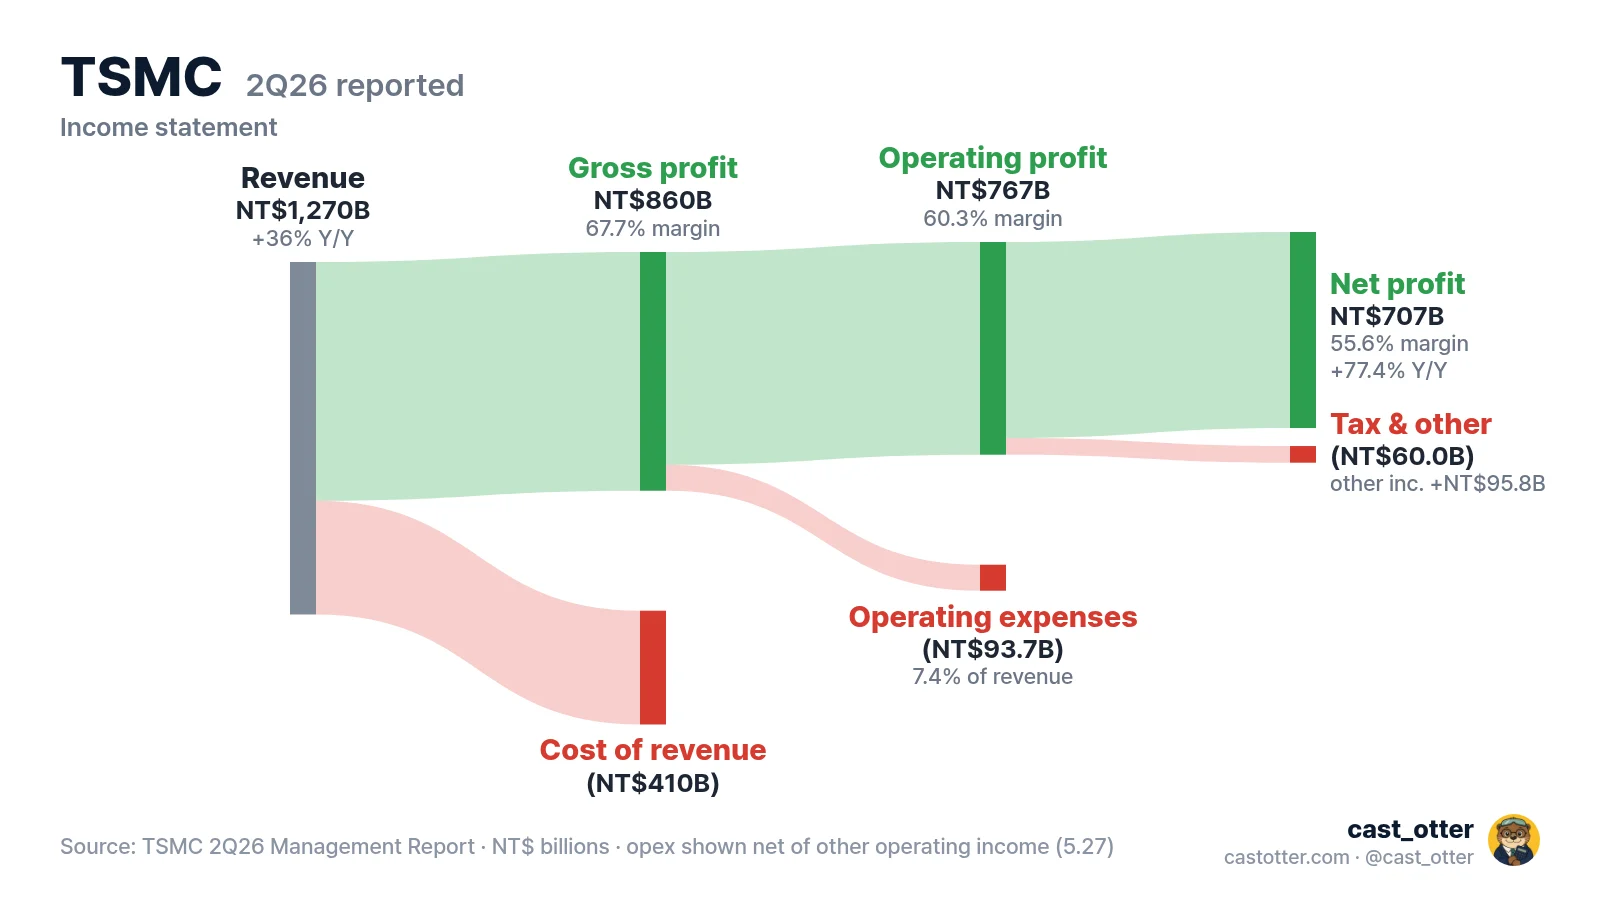
One thing to flag. Q2 net income included NT$95.83B of non-operating gains. NT$63.20B of that was a gain on the disposal and remeasurement of TSMC's VIS stake. When you put Q3 next to Q2, operating income is the cleaner comparison.
4. Margins are the real question
TSMC's Q3 margin guidance:
Gross margin 65–67%, operating margin 56–58%
That's below Q2's 67.7% and 60.3%. The company pointed to dilution from overseas fabs and the steep ramp of its 2nm process.
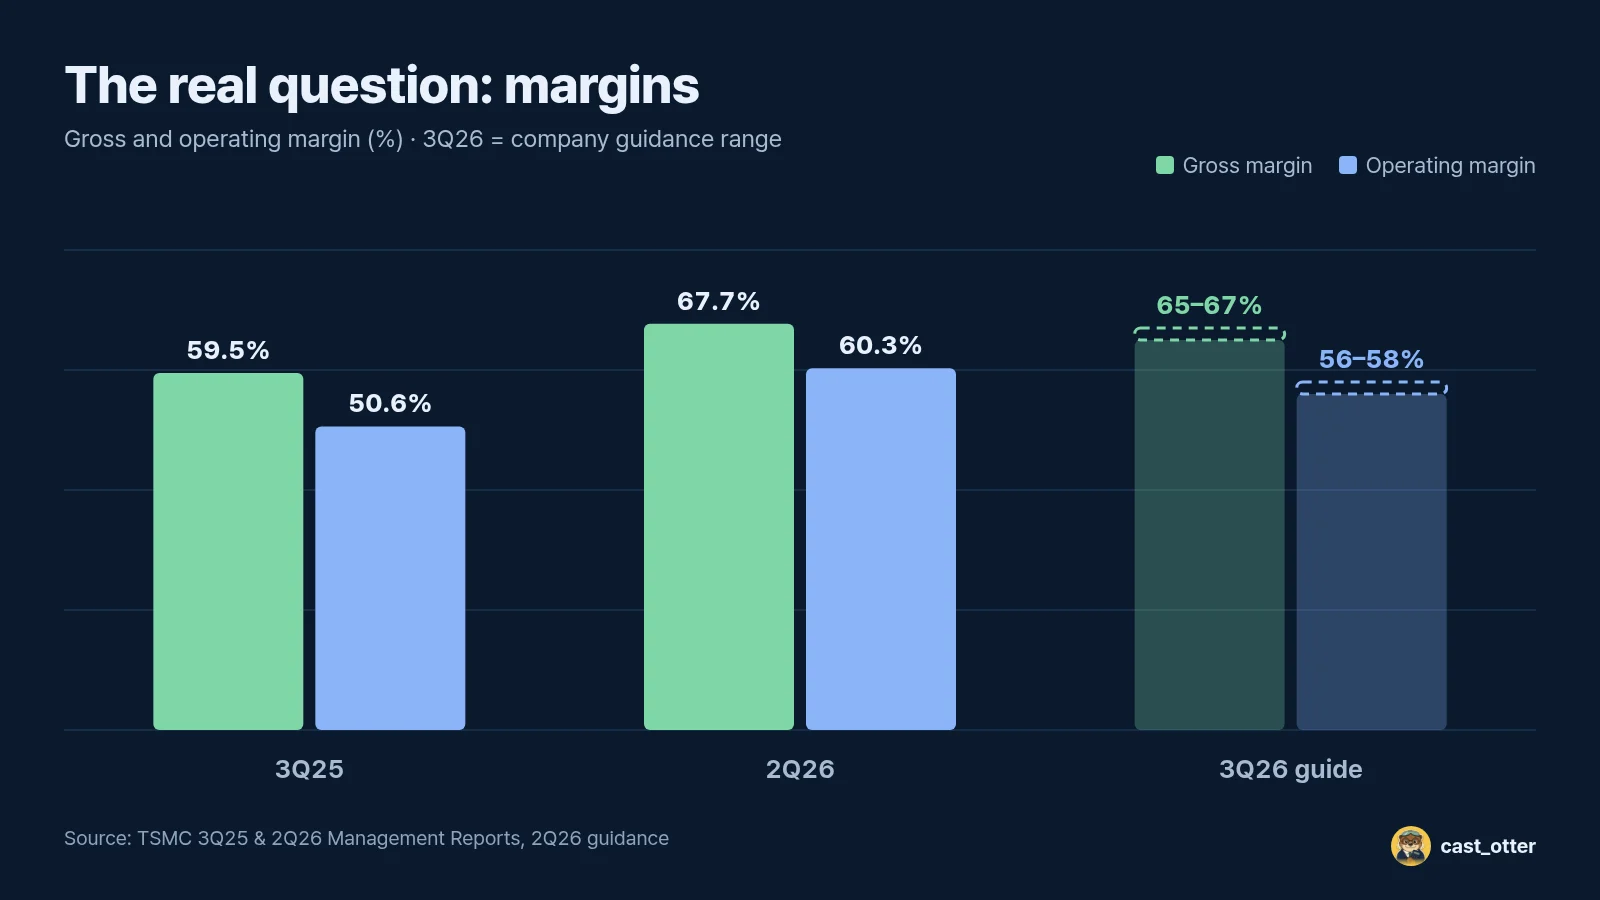
Apply the guided margins to the monthly revenue sum and you get rough ranges. These are cast_otter calculations.
- Gross profit: NT$971.3–1,001.1B
- Operating income: NT$836.8–866.7B
A year ago, the Q3 operating margin was 50.6%. Even the bottom of guidance would mean more than 5 points of expansion in a year. So the thing to watch on Thursday is where in the range the margins land.
5. Checklist for Thursday, 15:00 KST
The call is on Thursday, Oct 15, at 14:00 Taiwan time (15:00 KST). TSMC has been in its quiet period since Oct 5, running through Oct 14.
- Gross margin: where in 65–67%, and how far down from Q2's 67.7%.
- Operating margin: where in 56–58%, and whether the revenue beat shows up as operating leverage.
- Overseas-fab dilution: any update on how big it is.
- 2nm ramp: revenue share, yields and cost commentary.
- Q4 guidance: revenue, margins and the exchange rate assumption.
When the numbers land, the earnings card gets redrawn first. Numbers first.
Sources
- TSMC, September 2026 revenue report (2026-10-08): https://pr.tsmc.com/english/news/3343
- TSMC, August 2026 revenue report: https://pr.tsmc.com/english/news/3340
- TSMC, 2Q26 Management Report and earnings release (incl. Q3 guidance): https://investor.tsmc.com/english/quarterly-results/2026/q2
- TSMC, 3Q25 Management Report: https://investor.tsmc.com/english/quarterly-results/2025/q3
- TSMC IR financial calendar (3Q26 call Oct 15, 14:00 Taiwan): https://investor.tsmc.com/english/financial-calendar
- TSMC monthly revenue filings (SEC Form 6-K): https://www.sec.gov/cgi-bin/browse-edgar?action=getcompany&CIK=0001046179&type=6-K
- July 2025 revenue is a cast_otter calculation: Q3 2025 revenue minus August and September.
More articles
ASML Q3: the bar is already set high
ASML guided Q3 net sales to €11.0–12.0B, 18–29% above Q2. On Wednesday Oct 14, watch margins, the Q4 math and what the company says about orders.
Read
AI API prices, October 2026: same chatbot, a 100x gap
We checked per-million-token prices for Claude, Gemini, OpenAI, Grok and Workers AI on the official pages on 2026-10-11. For a 2,000-request-a-day chatbot, the monthly bill runs from $13.95 to $1,395.
Read