
← All works Works · 01
P&L Control Tower
The whole P&L in one file. The chatbot never recalculates; it looks answers up in tables that are already computed.
01The problem
After month-end, the same P&L gets rebuilt several times: for reporting, for each business unit, for each channel. The numbers drift a little each time. Adding a chatbot makes it worse, because it does its own arithmetic and gets it wrong.
02How it works · 3 steps
Build
A script gathers the ledger data into one HTML file. No external scripts: if you have the file, it opens.
Look
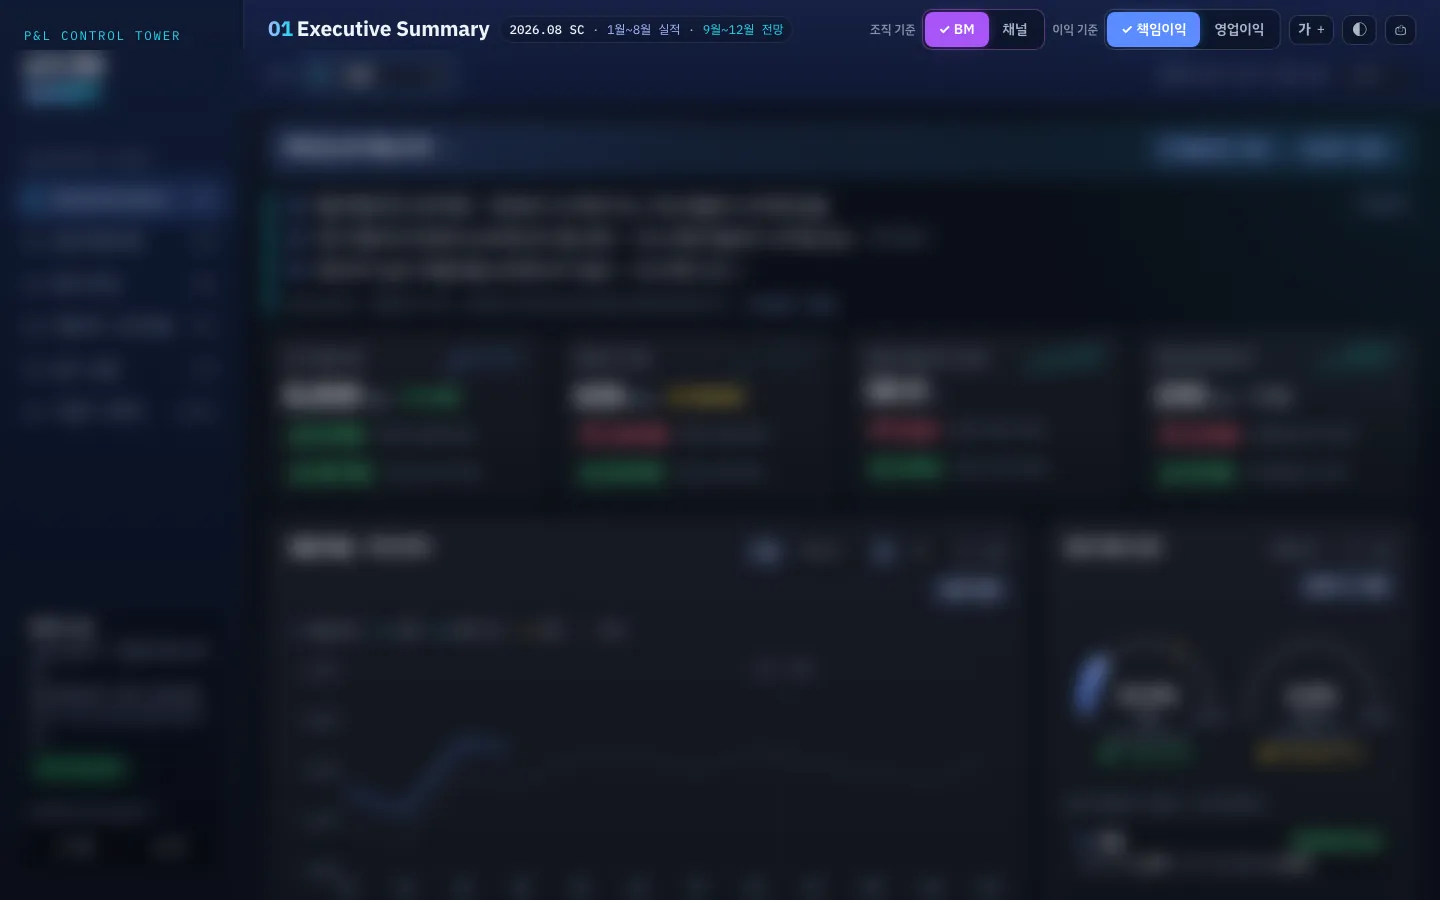
Six screens: summary, forecast, profitability, costs, alerts and more. Switch between unit and channel views and click a number to drill down. Every line gets a verdict badge.
Ask
The dashboard exports what it has already computed as tables and a fact book. The chatbot only looks answers up there. Its one rule: “Look it up. Don’t make it up.”
03Screens
04Stack
- HTML · CSS · SVG, no libraries
- Spreadsheet macros or Python
- The agent builder in an office suite
- No AI model does any arithmetic at runtime
05Status
It runs on real P&L data, so the figures are blurred. A demo built on an invented company is open for you to play with.
Open the tower with fake data→